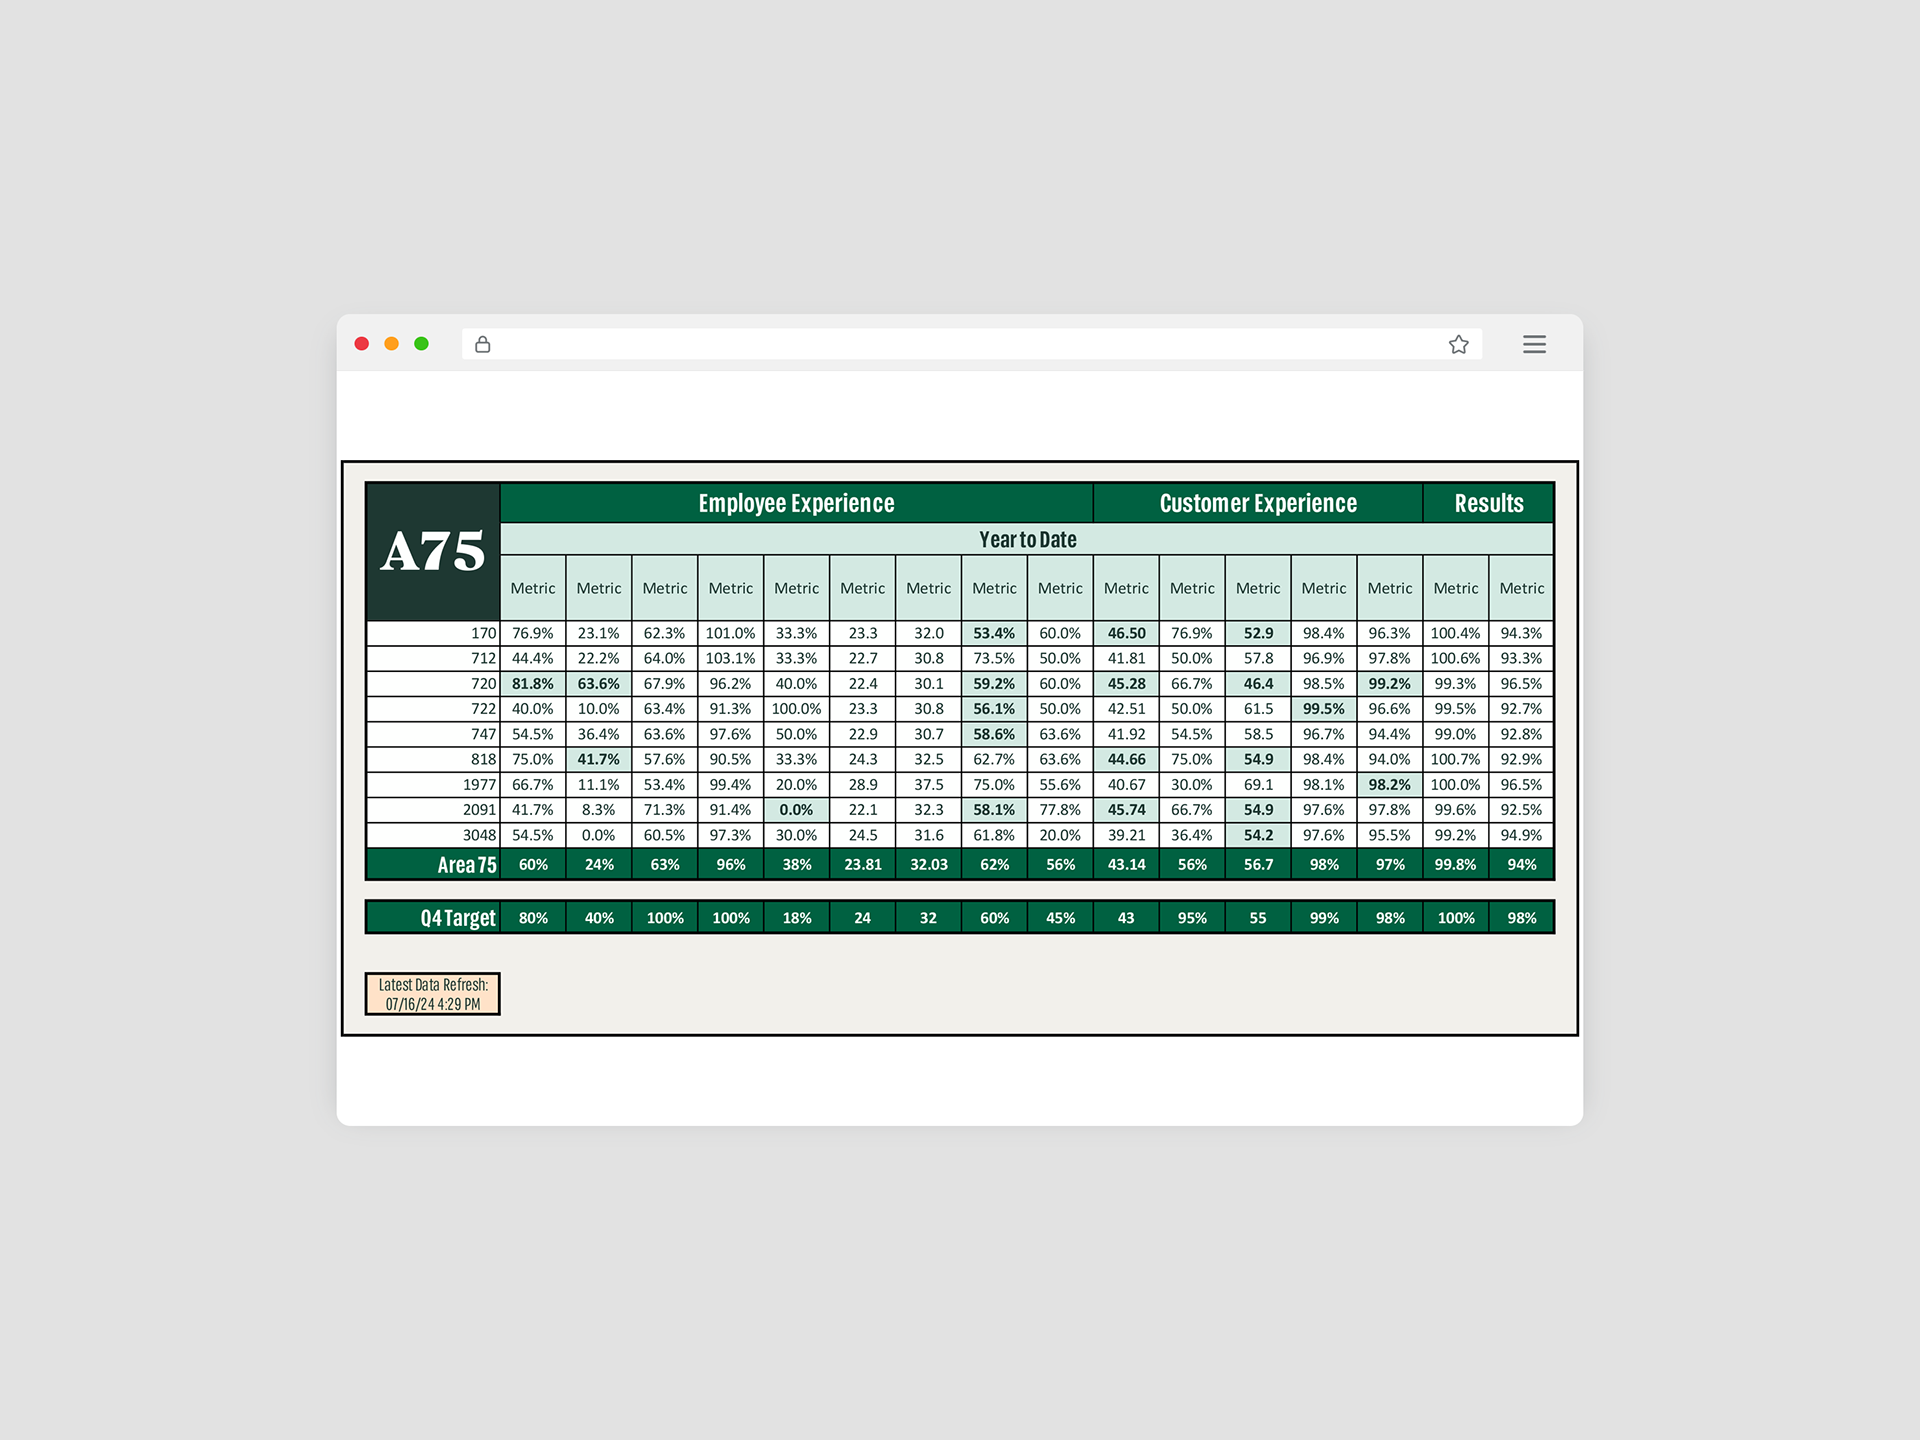
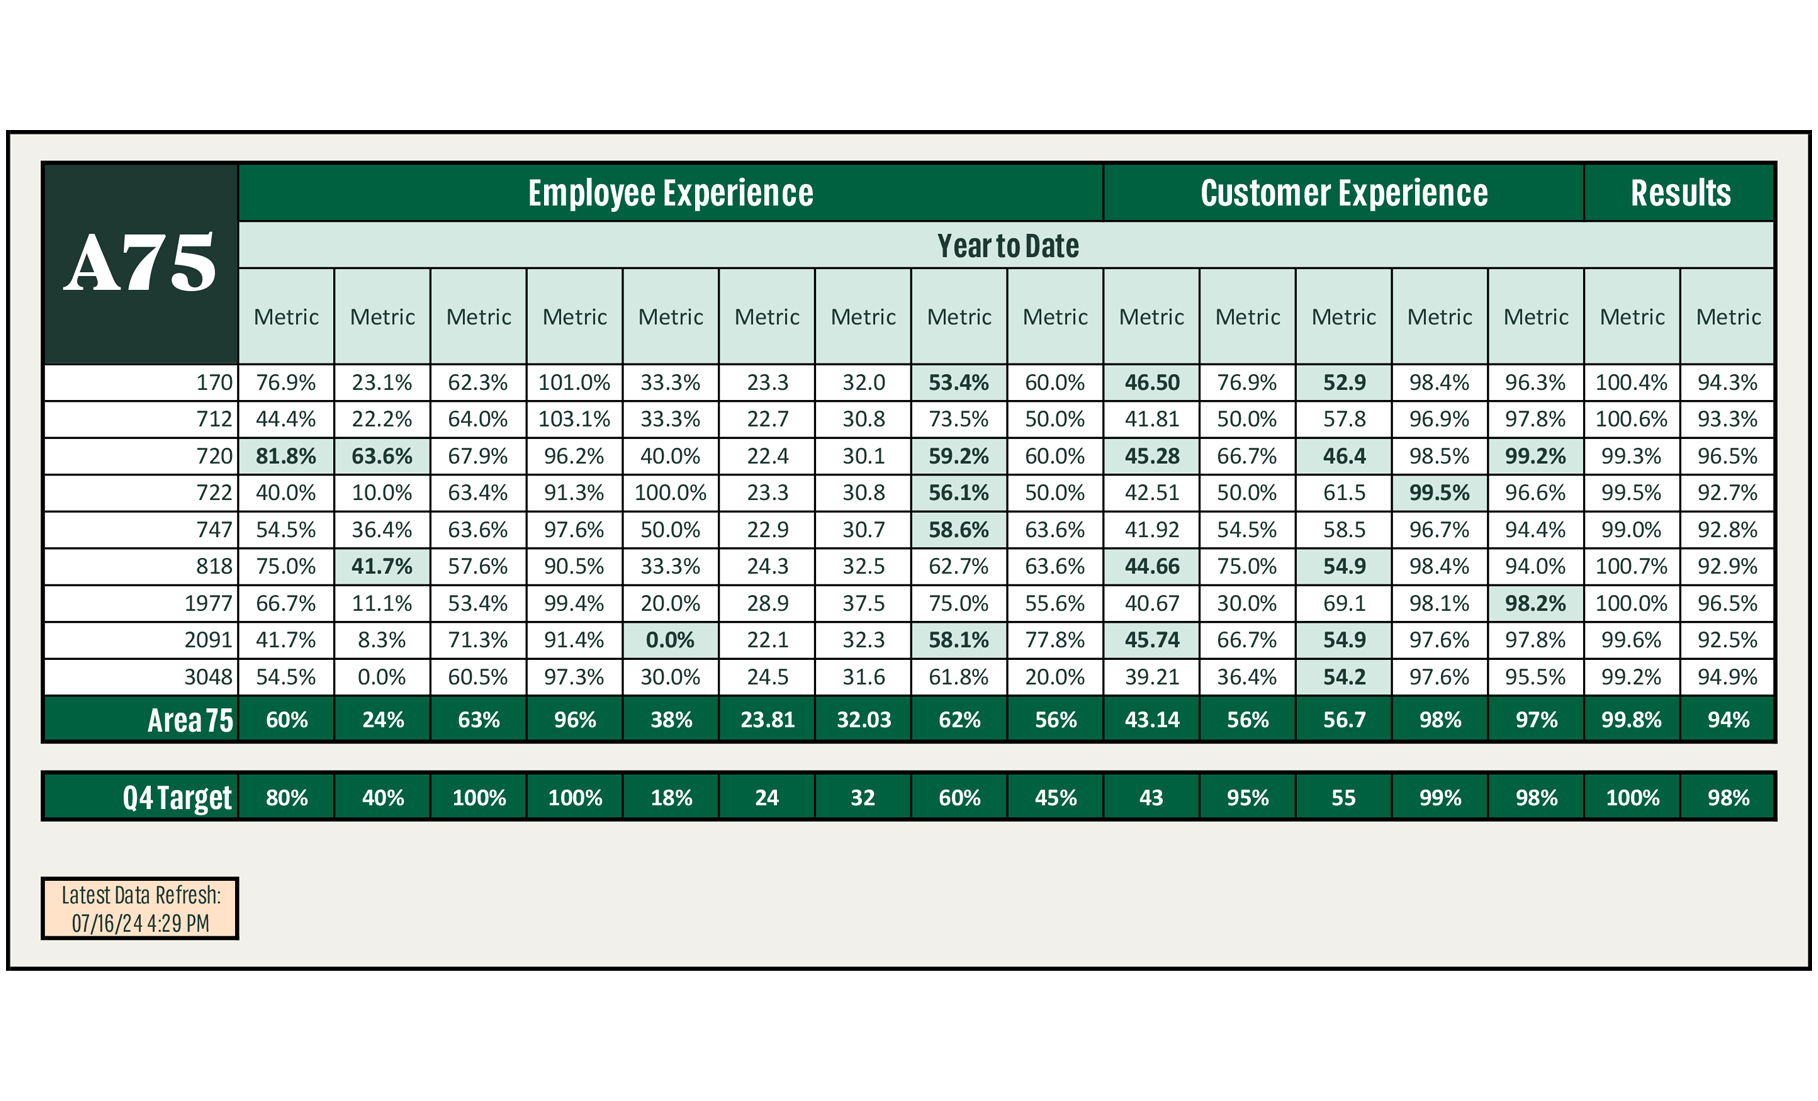
Need a one-stop-shop for all those metrics you're tracking this quarter? Look no further – I developed a table that tracks each of the KPIs we'd normally have to find in 8 different reports, which takes time away from your admins.
PowerQuery is used to shape and sort 8 Tableau reports, which are digested into Pivot Tables. The XLOOKUP function searches for district numbers in the Pivot Tables to display your KPIs in one table.
Oh, did I mention KPIs within target will appear green? You can get a weekly glance of which leader is achieving the most metrics to target, all with the click of a button.